This post, is an article which I wrote for the SDN magazine. I decided to also publish it on this blog. It is about distributed systems, micro service architectures and traceability within such a distributed system.
With all IT systems, traceability is an important non-functional requirement. If the traceability of a system is high, it is easier to find the root cause of a problem that occurs in a production environment. As a system gets distributed over multiple applications or services, tracing a problem in a production environment becomes more difficult. As there are simply more application and services to check. New architectures such as a microservices architecture makes this even more difficult because the functionality of the system can literally be distributed over dozens or hundreds of services. The services could be implemented using different development languages and be running on different platforms. This article describes a solution for increasing the traceability of a distributed system by using Log aggregation via the ELK stack.
 Figure 1. Microservices architecture
Tracing using the Elk stack
Most distributed systems consist of different types of applications implemented using different programming language running on different operating systems. Normally these systems grow organically over time. There is not a single standard way of logging when a service or application fails.
The most common way to log error events is writing these events in log files. Each row of these text files minimally contain a timestamp and some data about the event. With a distributed system such as a microservices architecture this could mean that an engineer has to go through hundreds of log files to find a problem.
The ELK stack provides a solution for this problem by aggregating all of these log files into a single system. The ELK stack combines the Elasticsearch, Logstash and Kibana products. Elasticsearch is a search and analytics engine, Logstash is a tool for scrubbing and parsing log data into a single format and Kibana is a visualization engine to interact with Elasticsearch.
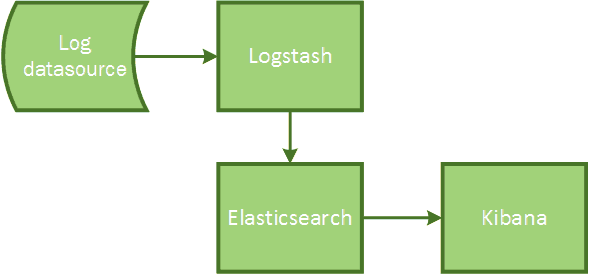
Figure 2. ELK stack overview
The logs of a system are transported through and enhanced by Logstash. The data is then indexed and stored by Elasticsearch and finally visualized using the Kibana dashboard. All the components of the ELK stack are open source. Logstash is implemented using JRuby, Elasticsearch uses Java and Kibana is implemented using HTML, CSS and JavaScript. Although these three products work great together, they can also be used separately.
After the ELK stack is installed and configured you are able to search in real-time through the logs of all your applications and services. Using Kibana you are able to visualize trends and spot anomalies in your log files.
####Installing the ELK stack The ELK stack can be installed on Unix as well as Windows. For this article, I will be installing the ELK stack on a single Ubuntu server. The Ubuntu server will be running as a VM on the Microsoft Azure platform. The version of Ubuntu that I will be using is 14.04 LTS.
The installation of all components is done through a remote shell, using putty as an ssh client.
######Installing Elasticsearch
As Elasticsearch runs on top of Java, the first prerequisite we have to fulfill before we can install Elasticsearch is Java. We install Java by entering the following command on the command line.
$ sudo apt-get install openjdk-7-jre-headlessThis will download and install Java version 1.7. To validate if Java was installed correctly we enter the following command.
$ java –versionIf Java was installed correctly the following response will be generated (the version number may differ)
java version "1.7.0_65"
OpenJDK Runtime Environment (IcedTea 2.5.3) (7u71-2.5.3-0ubuntu0.14.04.1)
OpenJDK 64-Bit Server VM (build 24.65-b04, mixed mode)
To install Elasticsearch we first have to download the package. We download Elasticsearch with the following command.
$ wget https://download.elasticsearch.org/elasticsearch/elasticsearch/elasticsearch-1.4.1.debWhen downloaded we can install Elasticsearch with the following command.
$ sudo dpkg -i elasticsearch-1.4.1.debAnd start it with the following command
$ sudo service elasticsearch startWe can validate if Elasticsearch was installed and is running correctly by entering the following command.
$ curl http://localhost:9200Elasticsearch should give a JSON response that looks like the following
{
  "status" : 200,
  "name" : "Ultron",
  "cluster_name" : "elasticsearch",
  "version" : {
    "number" : "1.4.1",
    "build_hash" : "89d3241d670db65f994242c8e8383b169779e2d4",
    "build_timestamp" : "2014-11-26T15:49:29Z",
    "build_snapshot" : false,
    "lucene_version" : "4.10.2"
  },
  "tagline" : "You Know, for Search"
}
The name of the Elasticsearch node is automatically generated, so it will probably be different in your installation.
We now have the E of the ELK stack running. Next, we will install Logstash.
####Installing Logstash
Before we can install Logstash we first have to download the Logstash package. We download Logstash with the following command.
$ wget https://download.elasticsearch.org/logstash/logstash/packages/debian/logstash_1.4.2-1-2c0f5a1_all.debAnd install it by entering the following command
$ sudo dpkg -i logstash_1.4.2-1-2c0f5a1_all.debThere is an additional package with community added contributions for Logstash that we need. We download this package with the following command.
$ wget https://download.elasticsearch.org/logstash/logstash/packages/debian/logstash-contrib_1.4.2-1-efd53ef_all.debAnd install it using this command.
$ sudo dpkg –i logstash-contrib_1.4.2-1-efd53ef_allWe then issue the following command to start Logstash
$ sudo service logstash startThis concludes the installation of the L part of the ELK stack. We move to the last part, installing Kibana, the front-end.
####Installing Kibana
Kibana is implemented using HTML, CSS and JavaScript. Therefore, to run Kibana we need a web server. Kibana runs completely client-side in the browser, so we don’t have any server side dependencies. If the web server can serve HMTL you will be ok. I will be using nginx.
To install nginx enter the following command
$ sudo apt-get install nginxThe installation process will automatically start nginx. To validate if nginx is installed correctly and running issue the following command.
$ curl http://localhostnginx should respond as follows
<!DOCTYPE html>
<html>
<head>
<title>Welcome to nginx!</title>
<style>
…
We download and extract Kibana by entering the following command
$ curl https://download.elasticsearch.org/kibana/kibana/kibana-3.1.2.tar.gz
 | tar xvz
We then have to copy the Kibana folder to the nginx html folder by entering the following command.
$ sudo cp kibana-3.1.2 /* /usr/share/nginx/html –RTo validate if Kibana is working correctly we have to open two additional endpoints on the virtual machine running on Microsoft Azure. One endpoint for port 80 to be able to talk to the web server and another endpoint for port 9200 to let Kibana talk to Elasticsearch.
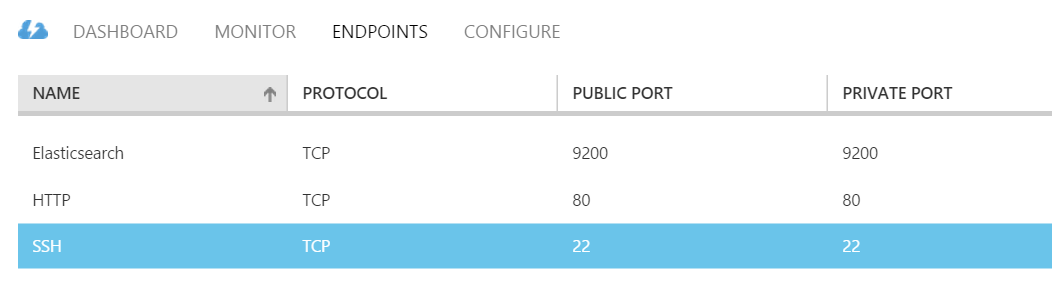 Figure 3. Azure Endpoints
When you now browse to your webserver you should be welcomed by the Kibana start screen.
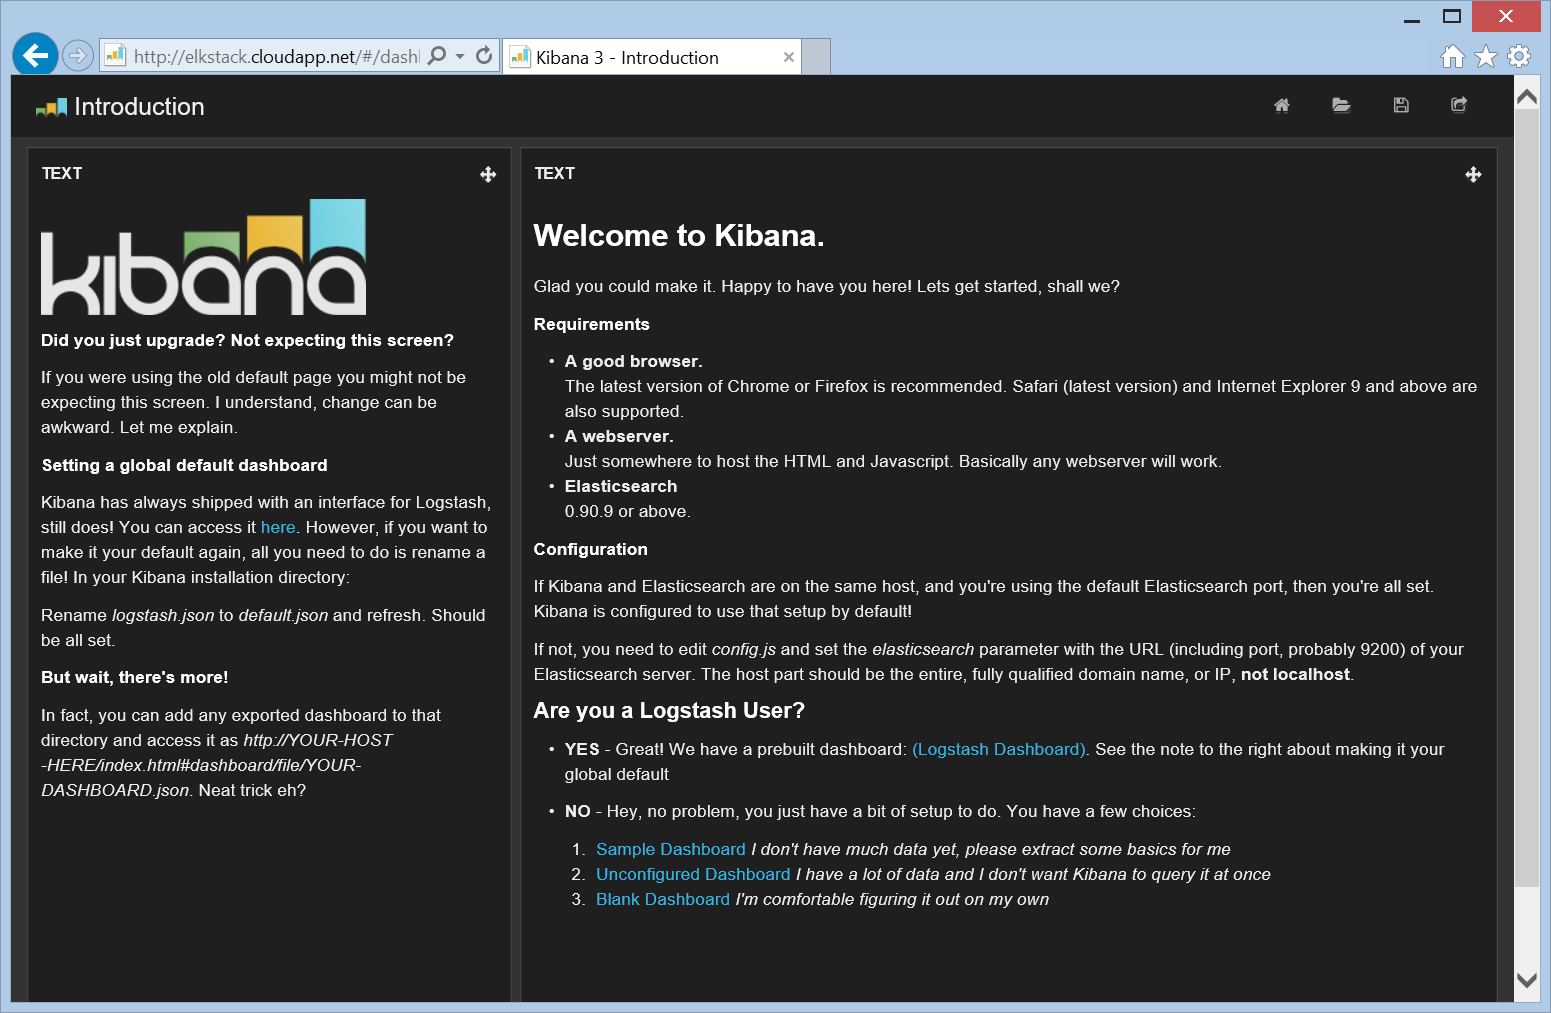 Figure 4. Kibana welcome screen
Congratulations, you have just installed all parts of the ELK stack. Next, we will look at configuring Logstash to get events into the system.
###Configuring Logstash
The community maintaining Logstash has an interesting project principle. It states that that if a newbie has a bad time using Logstash it’s probably a bug. The documentation should be improved.
Logstash is configured using a configuration file. A Logstash configuration file has the following structure.
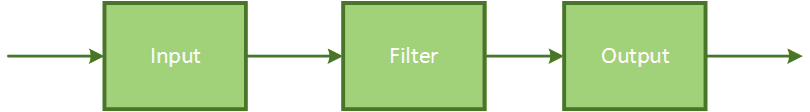
Figure 5. Logstash configuration file structure
The Logstash configuration file describes how events should flow through the Logstash pipeline with an input, filter and an output stage.
“If a newbie has a bad time, it’s a bug.”
Input specifies the source of the data. This could be a file, a TCP port or other input plugins that are available. Filter defines how the input stream should be parsed. Output defines where the parsed output should be sent and stored. Each part of the pipeline can be configured using the logstash configuration file. The configuration file resembles the structure of the pipeline.
input {
}
filter {
}
output {
}
Logstash contains several plugins that can be configured in each part of the pipeline. The list is too extensive to list here, but these are some examples.
- Input plugins (log4j, collectd, eventlog, tcp, wmi, udp, heroku, file)
- Filter plugins (grok, json, split, translate, drop)
- Output plugins (elasticsearch, agios, http, stdout, rabbitmq, websocket, tcp)
See the Logstash website for a complete list of available plugins.
The first real configuration we create is for parsing and indexing logs from an IIS server. We choose an IIS log because it contains a lot of different tokens we have to configure in the configuration file. Note that this could be any log file.
The Logstash configuration file should be stored on our Ubuntu server in /etc/logstash/conf.d/logstash.conf
input {
  lumberjack {
    port => 6379
    type => "IISLogs"
    ssl_certificate => "/home/azureuser/logstash.crt"
    ssl_key => "/home/azureuser/logstash.key"
  }
}
filter {
  if [type] == "IISLogs" {
    if [message] =~ "^#" {
      drop {}
    }
    grok {
      match => ["message",
      "%{TIMESTAMP_ISO8601:log_timestamp}
       %{IPORHOST:site}
       %{WORD:method}
       %{URIPATH:page}
       %{NOTSPACE:querystring}
       %{NUMBER:port}
       %{NOTSPACE:username}
       %{IPORHOST:clienthost}
       %{NOTSPACE:useragent}
       %{NUMBER:response}
       %{NUMBER:subresponse}
       %{NUMBER:scstatus}
       %{NUMBER:time_taken}"]
    }
    date {
      match => [ "log_timestamp", "YYYY-MM-dd HH:mm:ss" ]
      timezone => "Etc/UCT"
    }
    useragent {
      source => "useragent"
      prefix => "browser"
    }
    mutate {
     remove_field => [ "log_timestamp"]
    }
  }
}
output {
  elasticsearch {
  }
}
I will describe each part of the configuration file, starting with the input.
Input
The input plugin I am using is called lumberjack which is a specific input plugin specially created for securely receiving events from Logstash-forwarder. Logstash-forwarder is a type of application runs on your server and sends log events to the log server. Logstash-forwarder is an application that consume low resources.
The Logstash-forwarders motto:
♫ I’m a lumberjack and I’m ok! I sleep when idle, then I ship logs all day! I parse your logs, I eat the JVM agent for lunch! ♫
The lumberjack input plugin has several configuration fields which define on what port and which certificate is used to setup an encrypted connection. We are using port 6379 for the lumberjack input. To be able to send the log events securely to the server we need a certificate. This can be a self-signed certificate or a real certificate. I will show later how to create this certificate.
The type fields adds a new field called ‘type’ to each event. The value of this field when events are retrieved by lumberjack is “IISlogs”. Types are mainly used for filter activation, we can specify that a certain filter should only be used for events that have type=”IISLogs”, which we will describe next.
Filter
The filter actually tries to parse the data of the event. The first line of the filter contains a condition which checks the type of the event.
if [type] == "IISLogs" {This means that the lines following this condition will only be executed if the type of the event equals “IISLogs”. As you remember we added this type to events that are input using the lumberjack input plugin.
The next line states that events that start with a hash should be ignored.
if [message] =~ "^#" { drop {} }Lines in an IIS log file that start with a hash indicate a comment. These are normally only present in the header of the IIS logfile.
The next part uses the Logstash GROK plugin. GROK is a wrapper around a regular expression engine which enables you to reuse existing regex patterns. It is the ideal solution for parsing custom log messages and comes with 120 existing patterns.
Using GROK we are going to parse a IIS log event. A log line of a IIS log event looks like the following:
2014-12-08 00:00:17 172.16.12.172 POST /url1/api.asmx - 443 VODKIJKWIN 192.168.16.135 PHP-SOAP/5.3.28-1~dotdeb.0 200 0 0 343The grok match parameter specifies the pattern to parse this line.
grok {
  match => ["message",
    "%{TIMESTAMP_ISO8601:log_timestamp}
     %{IPORHOST:site}
     %{WORD:method}
     %{URIPATH:page}
     %{NOTSPACE:querystring}
     %{NUMBER:port}
     %{NOTSPACE:username}
     %{IPORHOST:clienthost}
     %{NOTSPACE:useragent}
     %{NUMBER:response}
     %{NUMBER:subresponse}
     %{NUMBER:scstatus}
     %{NUMBER:time_taken}"]
}
Note, that for readability the grok pattern has been split on to multiple lines. The actual grok match line should be on a single line.
It starts by reusing an existing pattern in grok called TIMESTAMP_ISO8601 which parses the date and time from the event and stores it into the field log_timestamp and ends with NUMBER which is stored into the time_taken field. An online tool is available for testing grok patterns.
After the GROK stage of the filter we have parsed the IIS log line into several specific fields.
The filter continues with using the date plugin. The date plugin is able to convert a field into a date time and use that date time as the timestamp of this specific event.
date {
      match => [ "log_timestamp", "YYYY-MM-dd HH:mm:ss" ]
      timezone => "Etc/UTC"
    }
If no time zone is specified it adds a default time zone of “Etc/UTC” to the event.
The user agent plugin parses user agentstring into structured data. It uses BrowserScope data to add information like family, operating system, version and device. Browserscope is an open-source project for profiling web browsers and storing and aggregating crowd-sourced data about browser performance.
useragent {
  source => "useragent"
  prefix => "browser"
}
The prefix field specifies to add “browser” to all of the extracted fields.
The last part of the filter shows the mutate plugin which enables you to mutate fields. You can remove, rename, replace or modify fields in events.
mutate {
  remove_field => [ "log_timestamp"]
}
Here we remove the log_timestamp field because we don’t need it anymore as it already converted into a timestamp.
As the log event is now parsed and has a timestamp it is time to move it to the output.
Output
In the output we specify a single output plugin. The elasticsearch plugin is obviously used for sending the event to Elasticsearch.
output {
  elasticsearch {
  }
}
No other fields are specified as we are running Elasticsearch on the same machine as Logstash. Otherwise we could have specified, for example the host and port.
Restart Logstash
We have to restart Logstash after we have added or changed the Logstash configuration file. We restart Logstash with the following command.
$ sudo service logstash restartThis concludes installing and configuring our ELK stack using a single server. The final part to getting log events into the server is adding and configuring a shipper on the server that contains the logs of the application that we want to monitor. Sending events to Logstash We first have to send the events to Logstash before we can parse, index and search through them. There are several so called shippers which are responsible for transmitting events to Logstash.
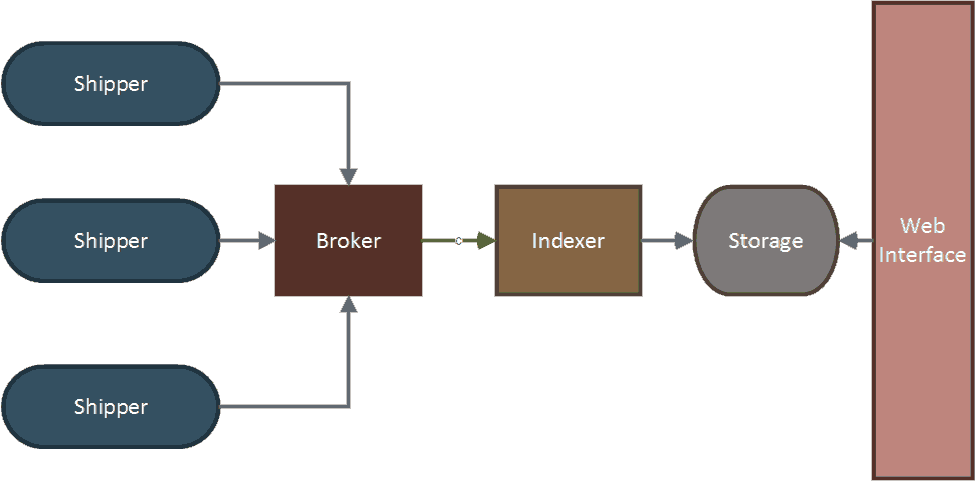 Figure 6. Shippers move events to Logstash
There are several shippers available that move events to Logstash. Logstash itself can also be used as a shipper. As Logstash runs with a footprint that is not friendly to under provisioned systems, several alternatives were created that have a smaller footprint, for example, the earlier mentioned Logstash-forwarder. Other alternatives are Beaver (written in Python) and Woodchuck (written in Ruby).
I will be using Logstash-forwarder as I develop a lot of software that has to run on Windows. Logstash-forwarder is developed in Go and as such can be compiled and run on Windows.
Currently there is no binary distribution of Logstash-forwarder, therefore to use it you have to compile it first. Instructions can be found at https://github.com/elasticsearch/logstash-forwarder.
As you may recall the input filter of Logstash used the lumberjack plugin to receive events from the logstash-forwarder.
input {
  lumberjack {
    port => 6379
    type => "IISLogs"
    ssl_certificate => "/home/azureuser/logstash.crt"
    ssl_key => "/home/azureuser/logstash.key"
  }
}
We are using port 6379 for the lumberjack input. To be able to send the log events securely to the server we need a certificate. This can be a self-signed certificate or a real certificate. I will be generating and using a self-signed certificate.
I used the openssl command line to generate the self-signed certificate on the Ubuntu server. We generate a private key and certificate with the following command.
$ openssl req -x509 -nodes -days 365 -newkey rsa:4096 -keyout logstash.key -out logstash.crtThe self-signed certificate needs several types of information to put into the certificate. The only thing that is important is the Common Name, this must be set to the fully qualified domain name of the logstash server.
After the self-signed certificate is created, you have to copy the logstash.key and the logstash.crt files from the Unbuntu server to the folder on the machine that contains the logstash-forwarder.
Creating the logstash-forwarder configuration file
Before we can start the logstash-forwarder we have to create a configuration file that instructs the forwarder where to get the log event from and where to send them. Below a configuration file called logstash-forwarder.conf I use on a machine to send IIS logs to my central logstash server.
{
  "network": {
    "servers": [ "elkstack.cloudapp.net:6379" ],
    "ssl ca": "Logstash.crt"
  },
  "files": [
    {
      "paths": [ " C:\\inetpub\\logs\\LogFiles\\W3SVC1\\*.log" ],
      "type": ["IISLogs"]
    }
  ]
}
It specifies under network which certificate to use and to what server the logs should be sent The files parameter specifies which paths and pattern should be used to search the log files. Pay special interest to using the double backslash on Windows as a folder separator. Before starting the logstash forwarder I have to add another end point to my Azure virtual machine to let Logstash connect to port 6379.
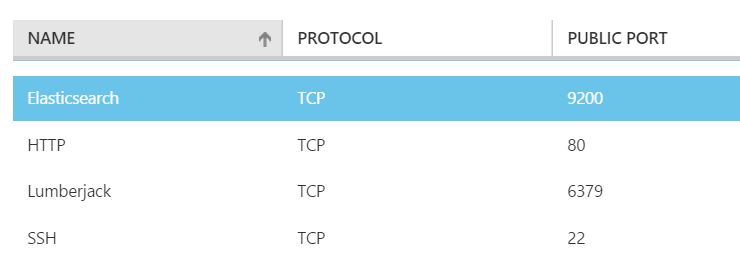
Figure 7. Specific end point for Lumberjack
The Logstash forwarder can now be started with the following command.
C:\lgf> logstash-forwarder.exe -config=logstash-forwarder.confThe logstash-forwarder will monitor the folder for new or added logfiles and will send them to the logstash server. To run logstash-forwarder in the background as a Windows service, we have to convert it into a Windows service. This can be done using NSSM (the Non-Sucking Service Manager).
####Filtering events using Kibana
After we got the event flowing into the server, we can visualize the events using Kibana. With Kibana you can create and save custom dashboards. The default installation already contains a dashboard which is configured for Logstash as can be seen in Figure 8.
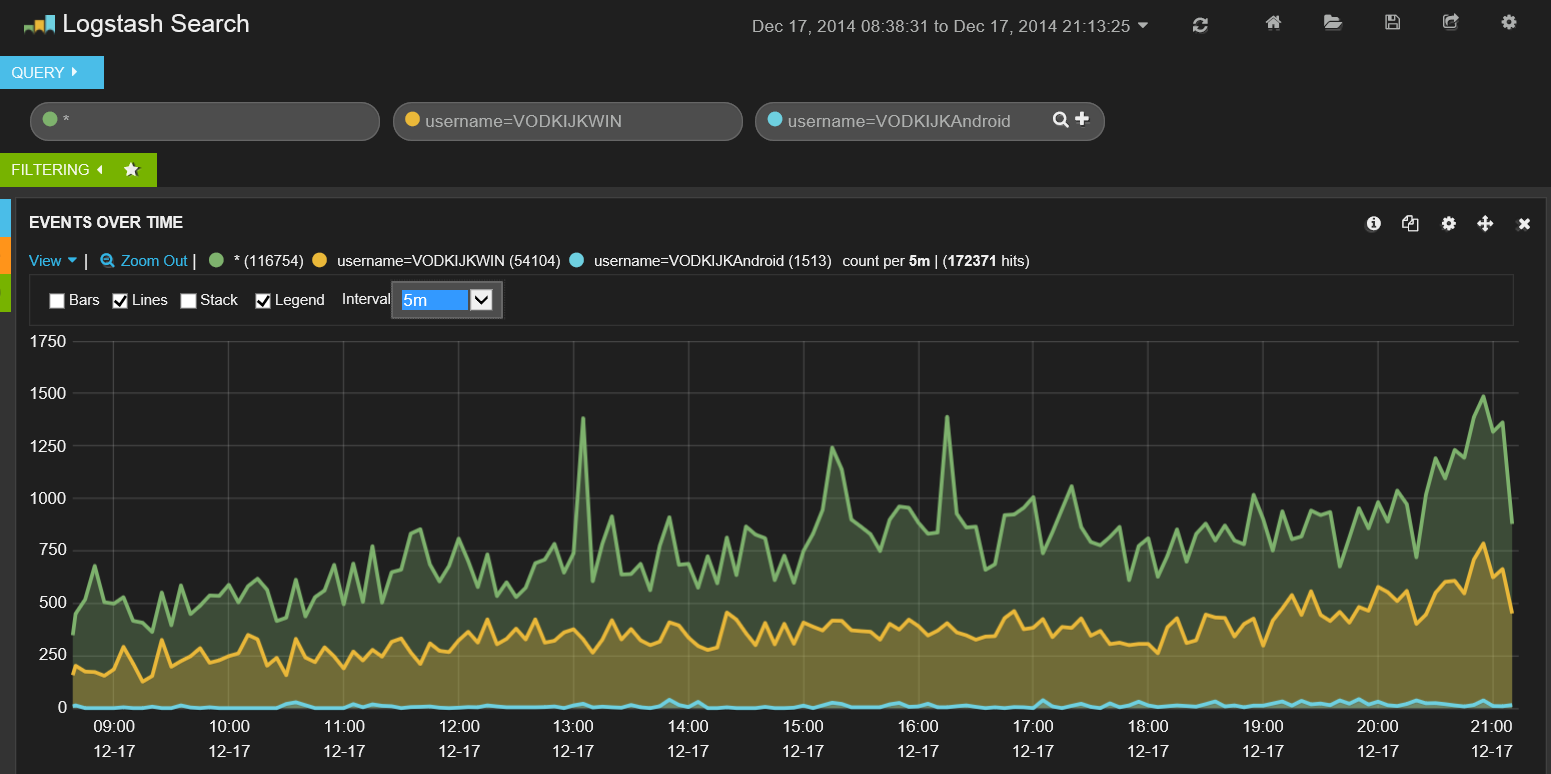 Figure 8. Default Logstash dashboard in Kibana
The default Logstash dashboard contains a graph which counts the number of events over time and includes a search field which allows you to search on free text or search in specific fields.
The functionality of Kibana deserves a separate article on its own. There are multiple ways to create graphs, combine geo-ip data and filters.
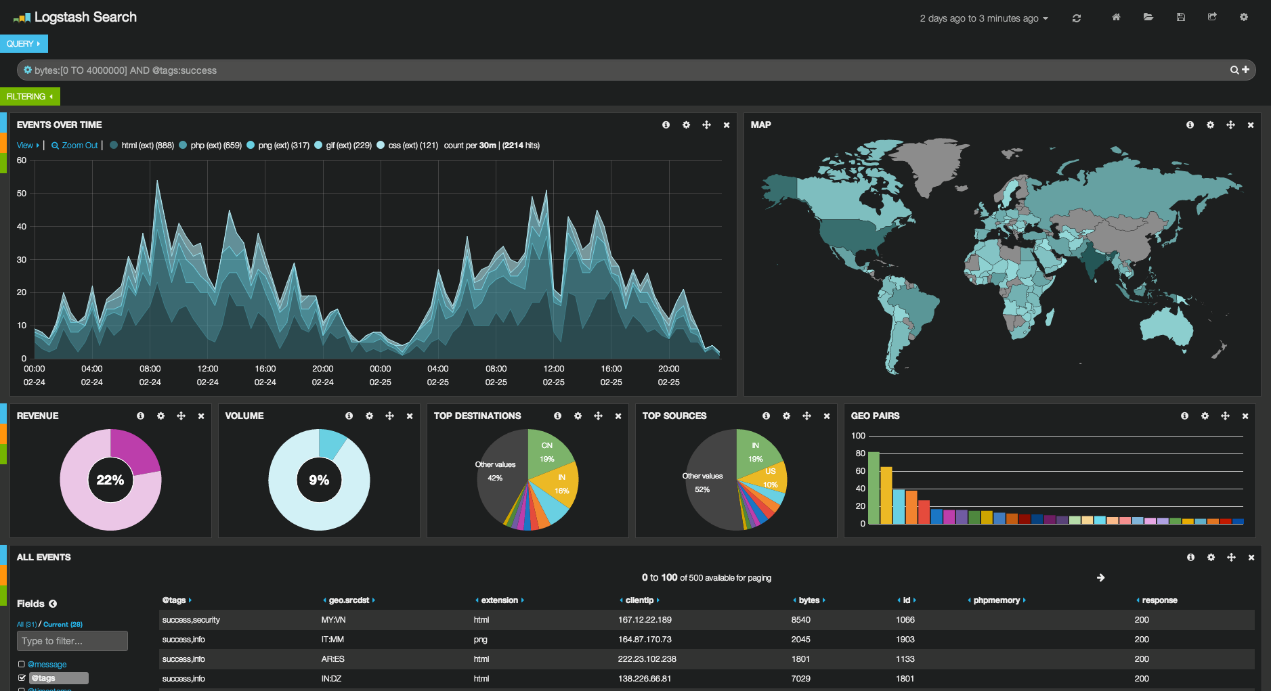
Figure 9. Kibana extended
####Scaling the ELK stack As we are going to expand our system to receive and group more logs, the single Logstash server that we are currently using won’t be sufficient. We have to scale our architecture. Current it looks like Figure 8.
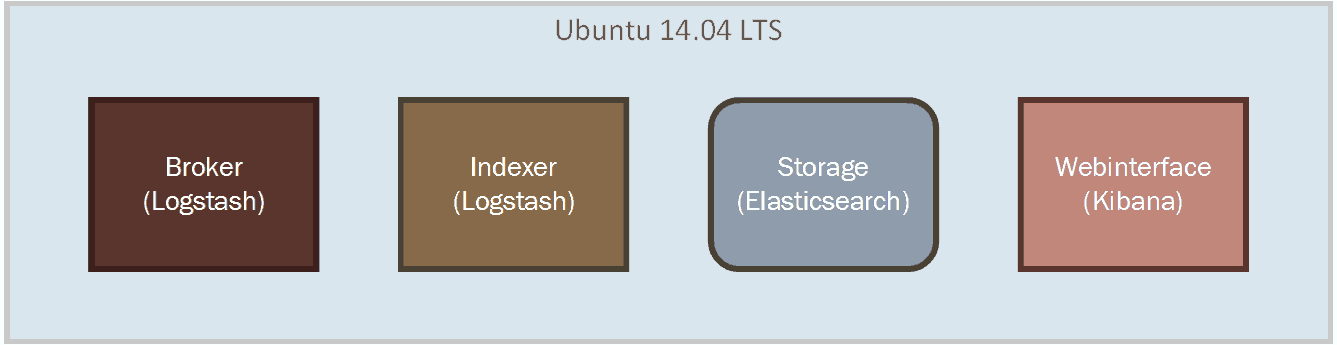 Figure 10. Current Architecture
The first thing we can scale is the Broker. Broker is the part that receives the log events. Currently we are using the message buffer from Logstash. A good way to scale the broker is to use Redis on a separate server to acts as a broker. Redis is a popular open source key value storage. Logstash includes plugins for using Redis.
To increase the throughput of the Indexer, we could also separate Logstash from Elasticsearch. So the new architecture looks like
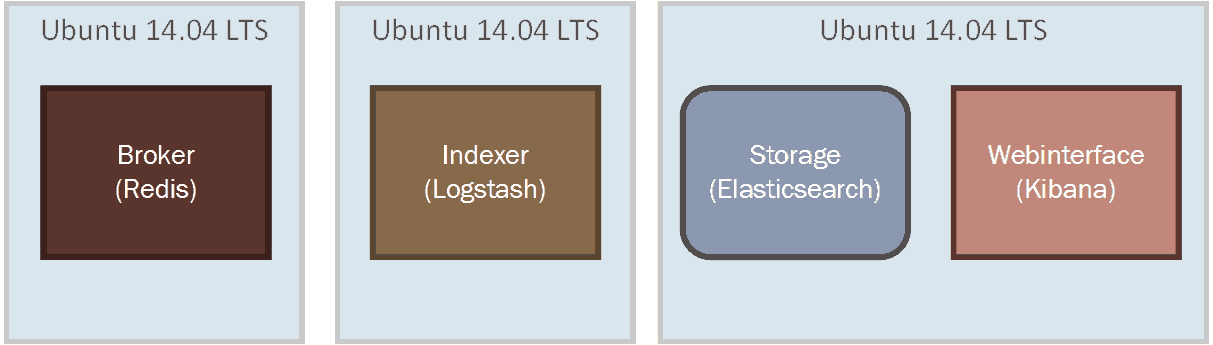 Figure 11. Scaled Architecture
This architecture can be scale horizontally very easily. We can add more Redis servers to increase the queue capacity, we can add more Logstash server to increase indexing capacity and add more nodes to the Elasticsearch cluster to increase the performance of querying and filtering of data. A first step into scaling horizontally looks like Figure 12.
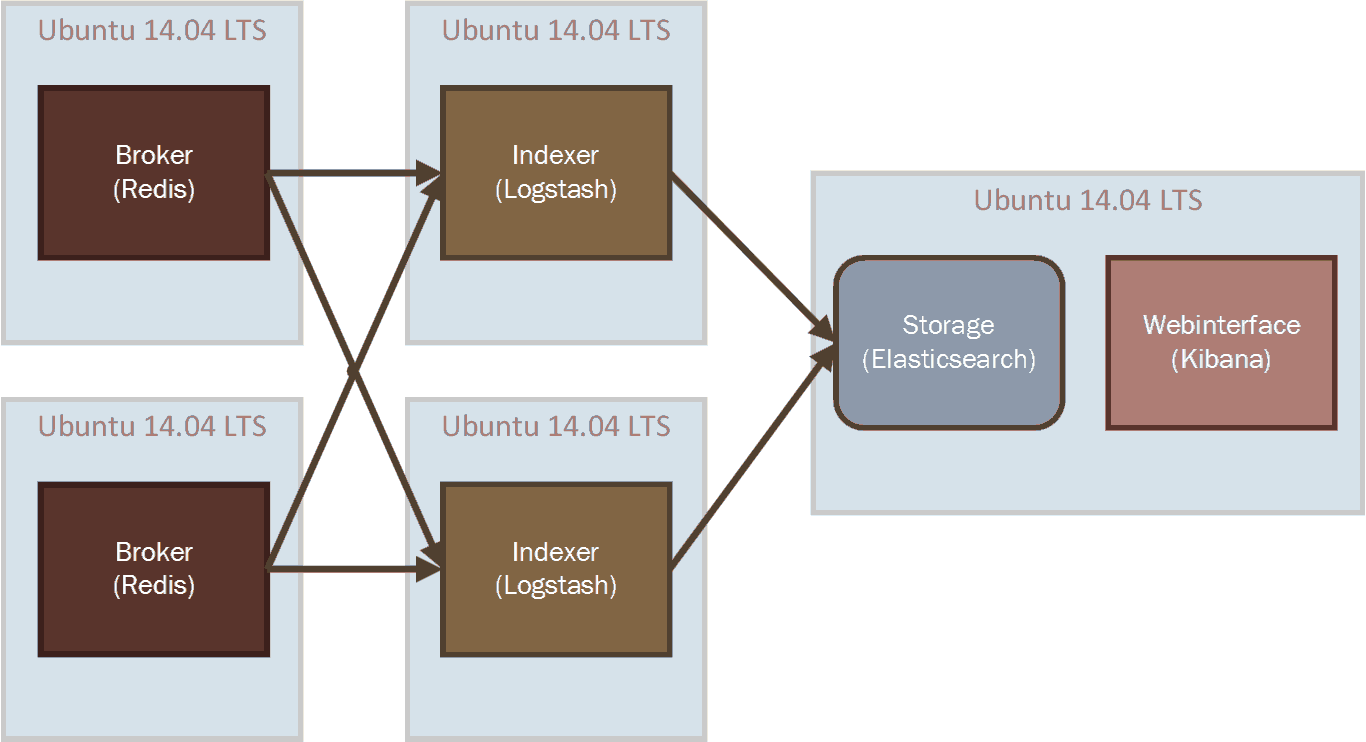 Figure 12. Horizontally Scaled Architecture
By cross connecting both Redis servers and the Logstash indexer we also create redundancy and fault tolerance between the systems. The shippers also can connect to both Redis servers so that if one of the servers goes down, a shipper is still able to send its events.
Elasticsearch can be scaled by adding new Elasticsearch nodes to the Elasticsearch cluster. It will automatically detect and distribute data over the available nodes.
Configuring the Scaled Architecture
To configure the horizontally scaled ELK stack we need to make some changes to the configuration files.
The Logstash configuration file on both indexers needs to change. We use the Redis plugin to get the input from both Redis servers.
input {
  redis {
    host => "redis-server1"
    port => 6379
    data_type => "list"
    key => "logstash"
  }

  redis {
    host => "redis-server2"
    port => 6380
    data_type => "list"
    key => "logstash"
  }
}
Currently Logstash-forwarder does not support connecting to Redis. The protocol that Logstash-forwarder uses includes compression, encryption and message acknowledgement, which Redis does not support. There are alternative shippers which do, such as beaver and woodchuck.
If we switch to using Logstash as a shipper we could configure it using the following output filter in which the events are sent to one of the two configured Redis servers.
output {
  redis {
    host => ["redis-server1:6379", "redis-server2:6380"]
  }
}
####Conclusion In this article I showed how to install and configure the ELK stack in such a way that enables transfering application logs from a Windows machine using logstash-forwarder to the machine that hosts the ELK stack. The host parses the application logs using Logstash, indexes the logs using Elasticsearch and allows visualizing hem using Kibana.
By combining the logs from all your services and applications you can improve the traceability of your IT system. All your logs become searchable in almost real-time. By parsing extra information using Logstash per application you could give more meaning to your existing logs without having to go through all the logs individually.
To scale out the ELK stack, Redis servers can be added together with separate Logstash servers. Scaling Elasticsearch is as easy as adding nodes to the cluster. The easy way the ELK stack can be scaled horizontally really shows the strength of the platform.
This article barely scratched the surface of what you can do with the ELK stack. Topics I did not cover but are very interesting are security, creating dashboards with Kibana, adding semantics to log events, alerting, exporting and creating your own Logstash plugins.
Other alternative platforms for log aggregation that you should consider when evaluating a log aggregation platform are Splunk, Sumologic and Scribe.